This post is a free follow up of Connecting RPi Pico W to AWS IoT Core. I will describe how to forward already received telemetry into InfluxDB.
InfluxDB
InfluxDB is a time series database well suited for storing telemetry or any other time series data. A very good alternative to InfluxDB is TimescaleDB. It is based on PostgreSQL with Timescale time series extension. However I will not be describing here pros and cons of time series databases as there are plenty of other articles. My main motivation of choosing InfluxDB over Timescale is cost. At the time of writing this post, InfluxDB Cloud offers a free tier.
You need to sign in at https://cloud2.influxdata.com/signup.
Once you create your account, you need to specify where to store your telemetry data and how to access it. InfluxDB is using buckets for storing the measurements with you data and you need to create one. On the left side menu, navigate to Buckets, click on +Create bucket button and choose a name for the bucket.
Use again the left side menu but this time choose API Tokens and click on +Generate API token button to generate an access token for just created bucket.
AWS settings
I will describe here one of the easiest integration between AWS IoT Core and InfluxDB and that is by triggering a lambda function directly from the IoT Core. The way how it works is that for every telemetry that is received, the IoT Core triggers our lambda function with the telemetry data. The lambda function connects to InfluxDB and stores the data there.
Be aware this is not optimal solution at all as it requires unnecessary resources and it would be too expensive for a real project. The reason is there would be too many lambda invocations, connections to InfluxDB and too many single telemetry transferred. For more serious projects, one would use Telegraf as it is optimized for batching and data transfer or alternatively AWS Kinesis etc.
AWS Lambda Function
Before we configure an IoT Core trigger we need to create the lambda function itself.
import influxdb_client, os, time
from influxdb_client import InfluxDBClient, Point, WritePrecision
from influxdb_client.client.write_api import SYNCHRONOUS

org = ""
bucket=""
url = ""
token = os.environ.get("INFLUXDB_TOKEN")

write_client = influxdb_client.InfluxDBClient(url=url, token=token, org=org)

# Define the write api
write_api = write_client.write_api(write_options=SYNCHRONOUS)

def lambda_handler(event, context):
    print(event)
    point = (
        Point("measurements")
        .tag("device_id", event["device_id"])
        .field("temperature", float(event["temp"]))
    )

    if "hum" in event:
        point = point.field("humidity", float(event["hum"]))

    if "light" in event:
        point.field("light", float(event["light"]))

    if "noise" in event:
        point.field("noise", event["noise"])

    write_api.write(bucket=bucket, org=org, record=point)
    return True
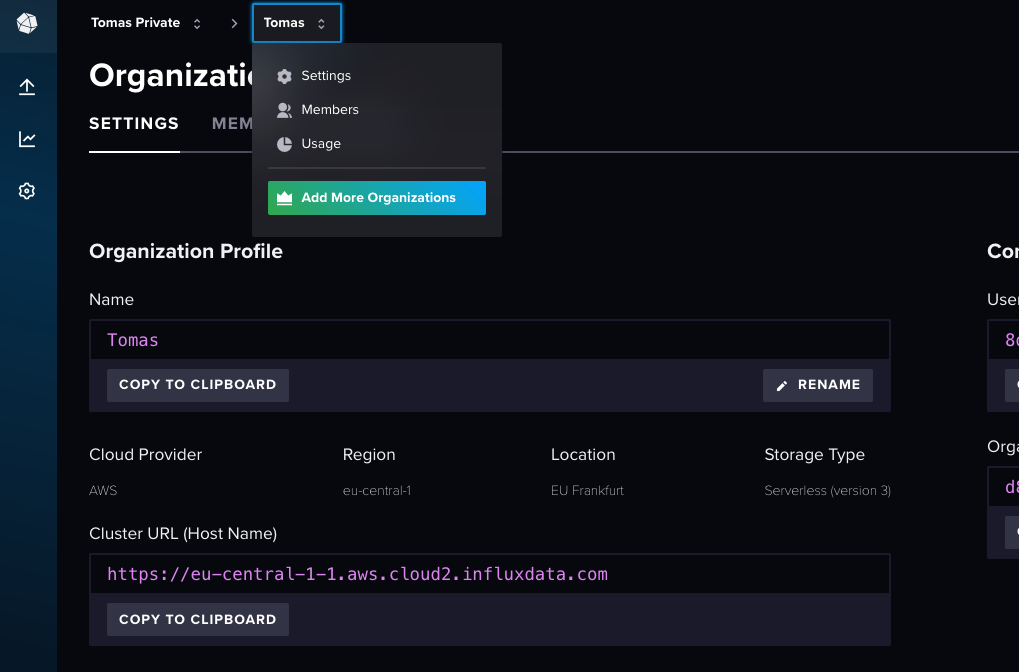
You need to set an org. The organization was defined during InfluxDB account creation and can be found on the top menu.. By clicking on it and choosing Settings you will be able to get an url.

The remaining variables are bucket and token and both have been defined in a previous step.
As you can see my Raspberry Pico measures temperature, humidity and detects noise. A telemetry may look like this:
{
    "temp": 21.9,
    "hum": 52.4,
    "light": 16.35767,
    "noise": 0,
    "device_id": "pico_w",
    "received_at": 1705960096501
}
Testing
You can try to send the above sample by manually executing the lambda. Then navigate to InfluxDB Cloud, open Data Explorer, select a Bucket and Measurement and run the following SQL-like query:
SELECT *
FROM "measurements"
WHERE
time >= now() - interval '1 hour'
AWS IoT Core
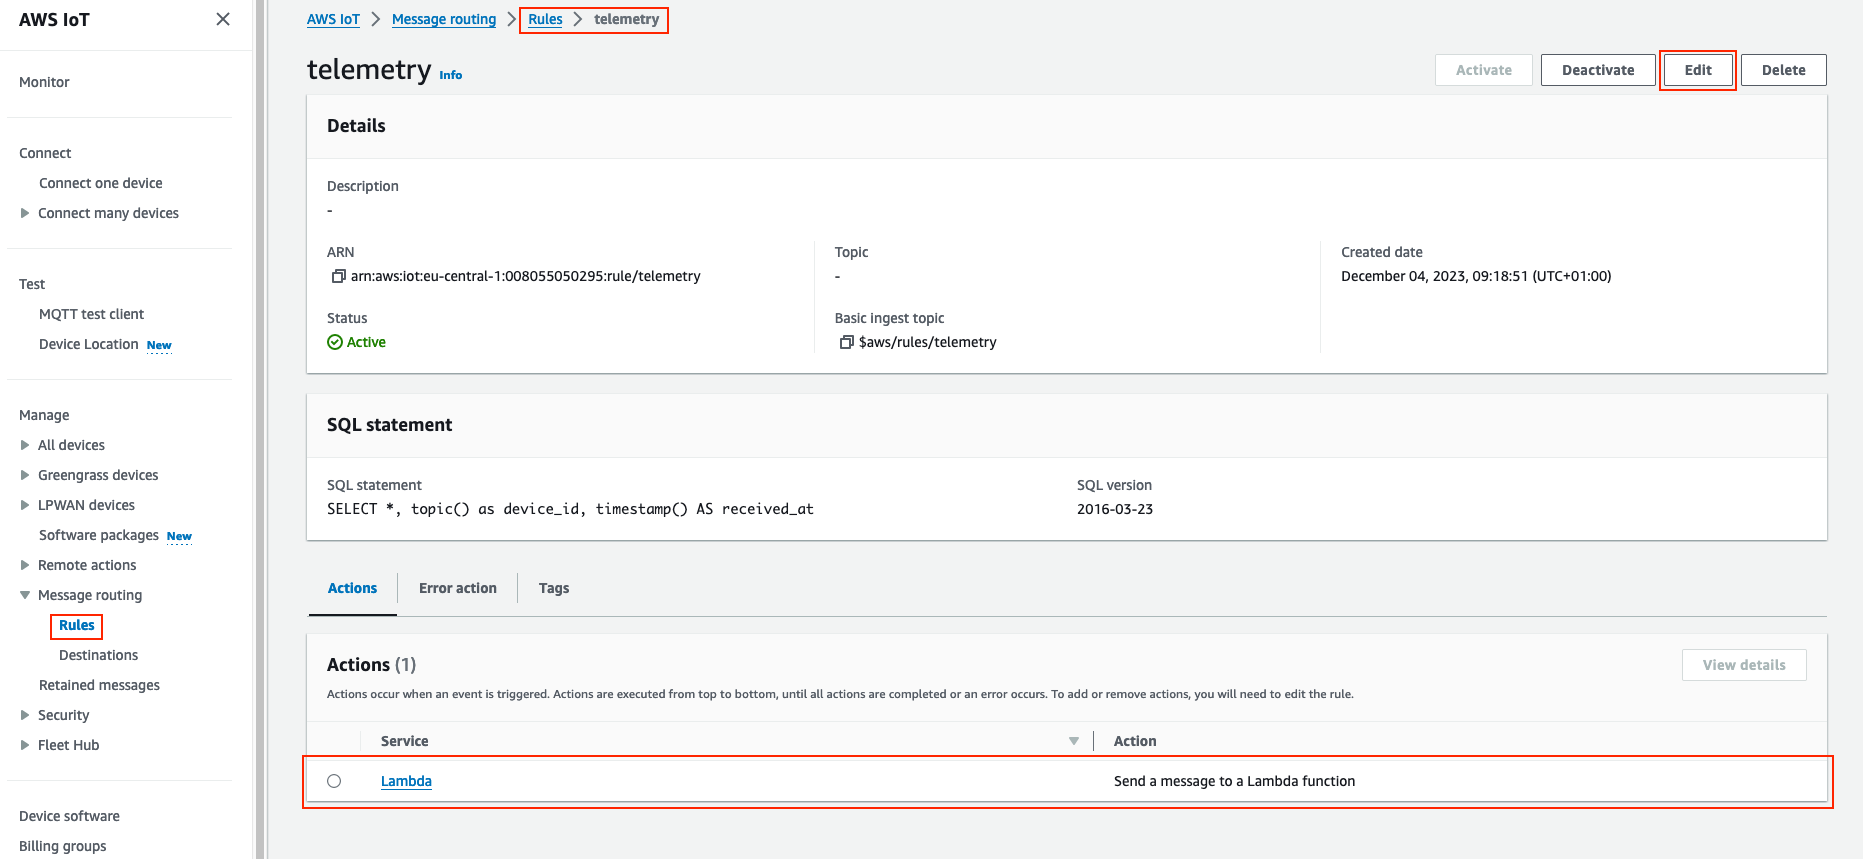
The last bit is connecting the IoT Core with lambda. Similarly as in the previous post, it is necessary to create / modify a Rule and add a Lambda trigger.

If all has been successful, your Raspberry Pico should be able to send telemetry to AWS IoT Core via MQTT. From there, each telemetry triggers a lambda function and the lambda stores it in InfluxDB.
